Outlier Exclusion
Use the Flag Tool to conveniently identify outliers and mark data points to exclude from the data analysis. Any flagged data point is excluded from all calculations.
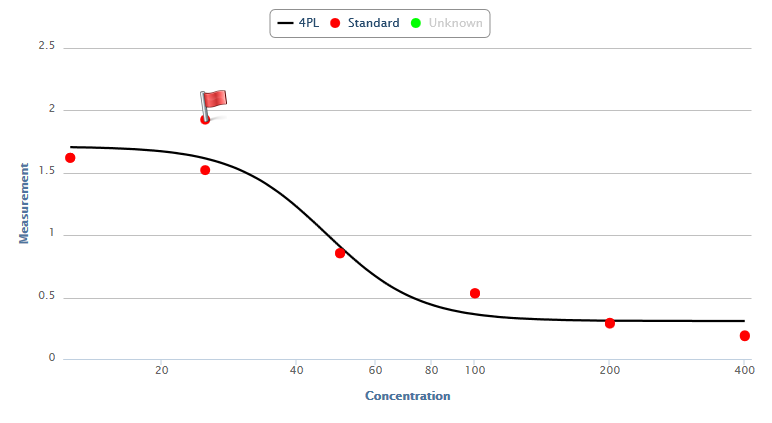
Sample data points can be flagged directly from the curve using the Interactive Chart. Simply click on each outlier and press the Recalculate button to create the new results, e.g.:
Any sample can be flagged in this way. Click the sample name in the header (such as Unknown) to show the other sample types.
In addition to flagging points from the curve, any data point can be flagged from the layout editor, click here for more…
Data Analysis with Flagged Points
When a point is flagged, it is excluded from any calculations.
Where replicates are in use, any remaining samples that are not flagged will be used. For example, if Unknown1 is made up of three replicates measured in positions A1, A2, and A3, and position A1 is flagged, then any reference to Unknown1 will refer to the average of A2 and A3.